
Breaking the "One-Size-Fits-All" Rigidity
The platform forced every company, regardless of industry or size, into the same rigid workflows, with no room to adapt to how each business actually tracks and reduces its carbon footprint.
The Constraint
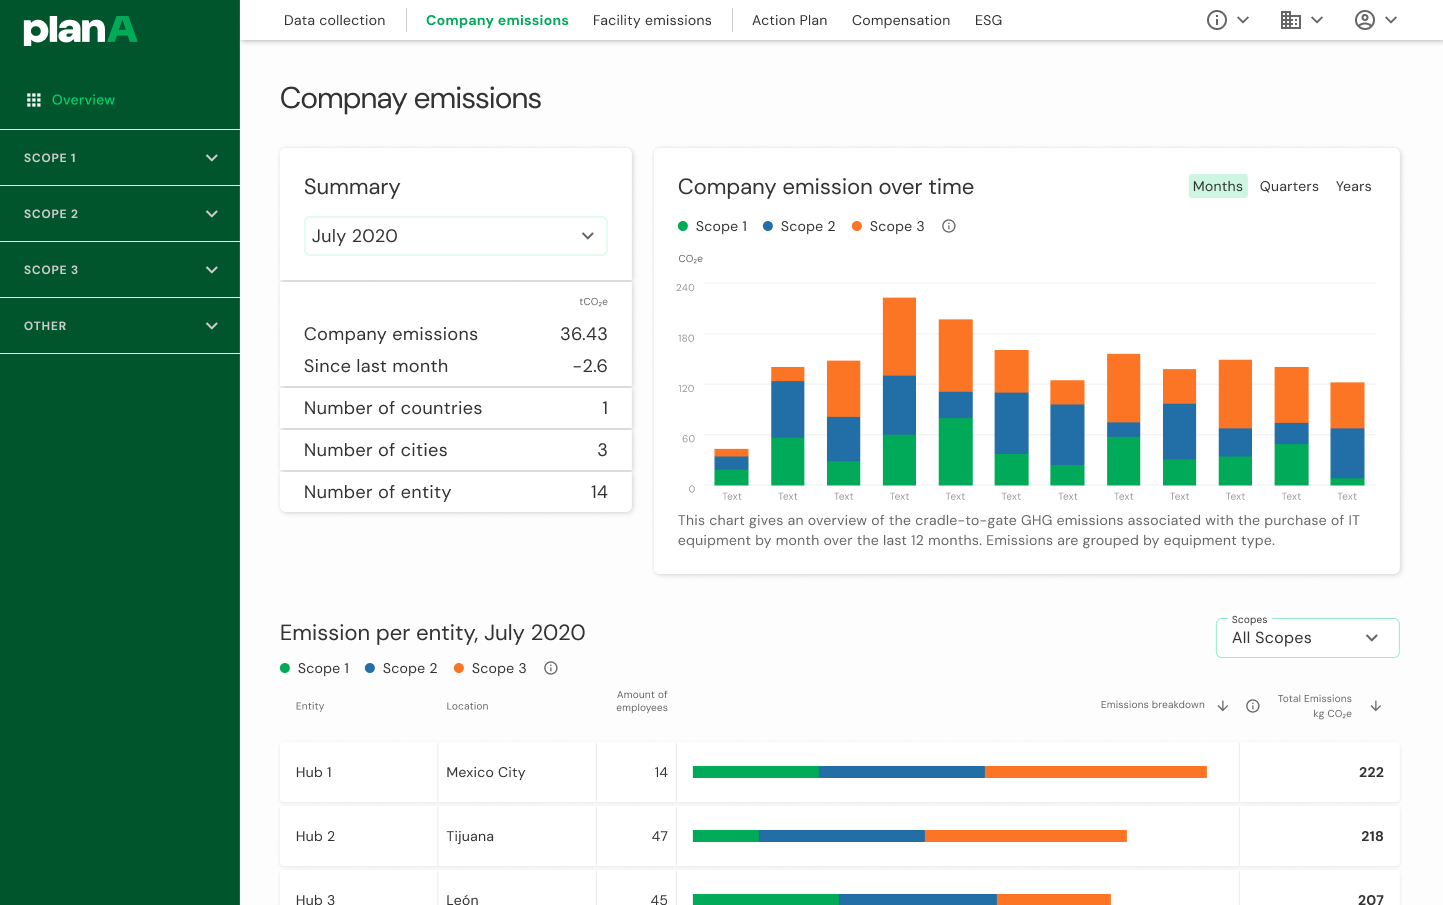
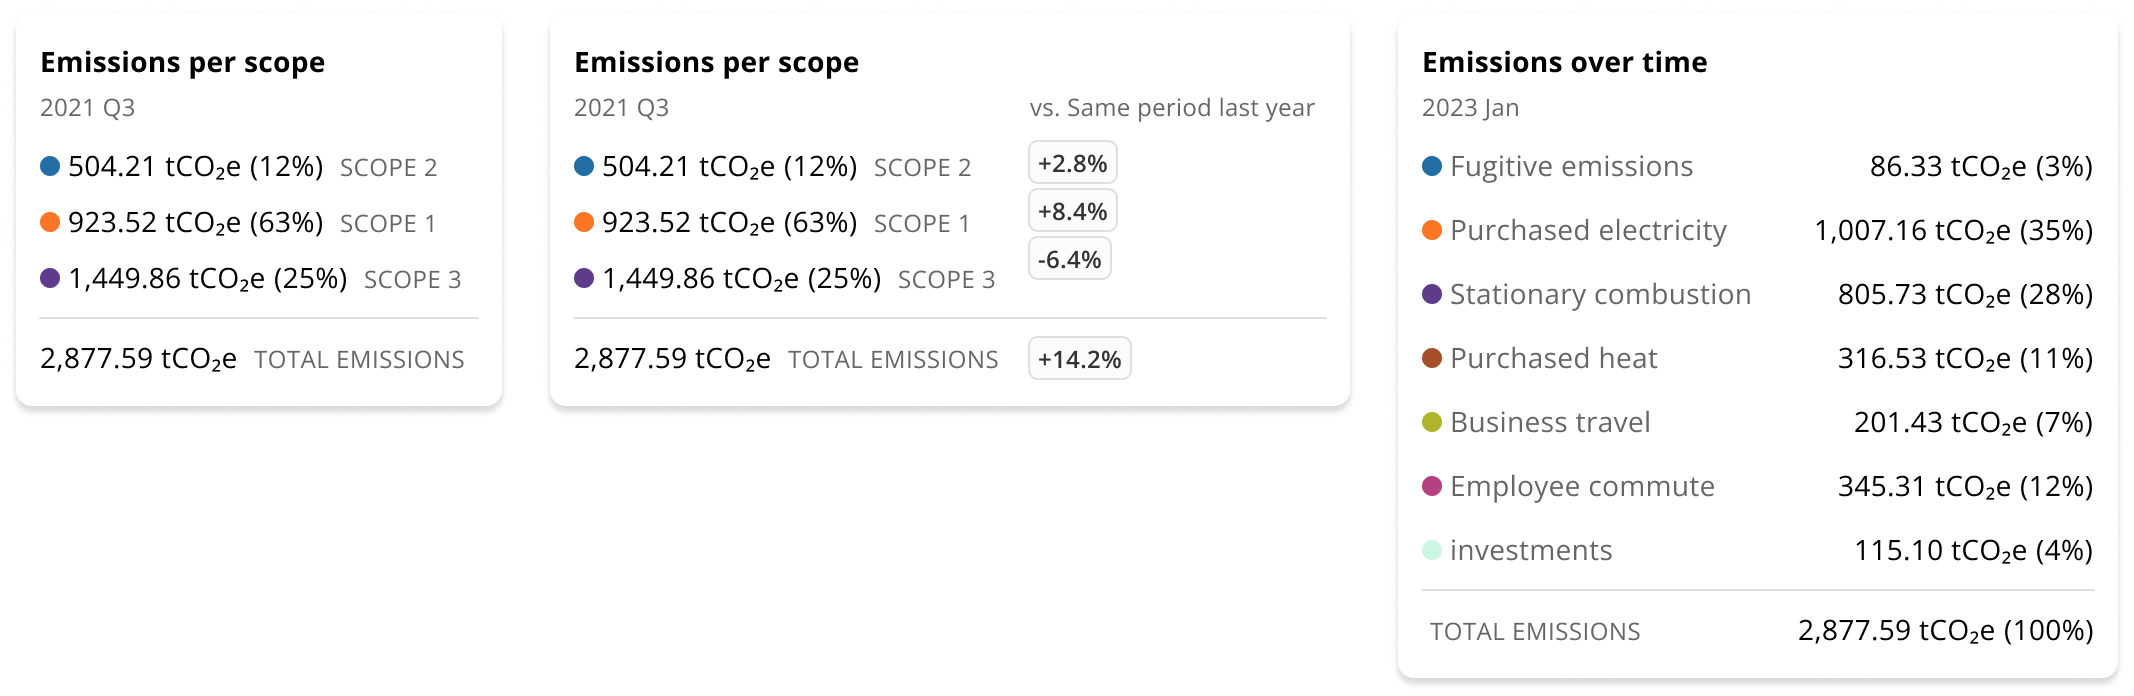
Dashboards lacked the flexibility for the complexity of real-world sustainability reporting, leading to manual workarounds that put pressure on retention → That meant burning CS and customer time every quarter producing customised spreadsheets and exports.
The Goal
Transform the product from a static functional tool into a desirable experience where carbon data was easy to explore, customise, and explain.
Architecting Self-Serve Customisation
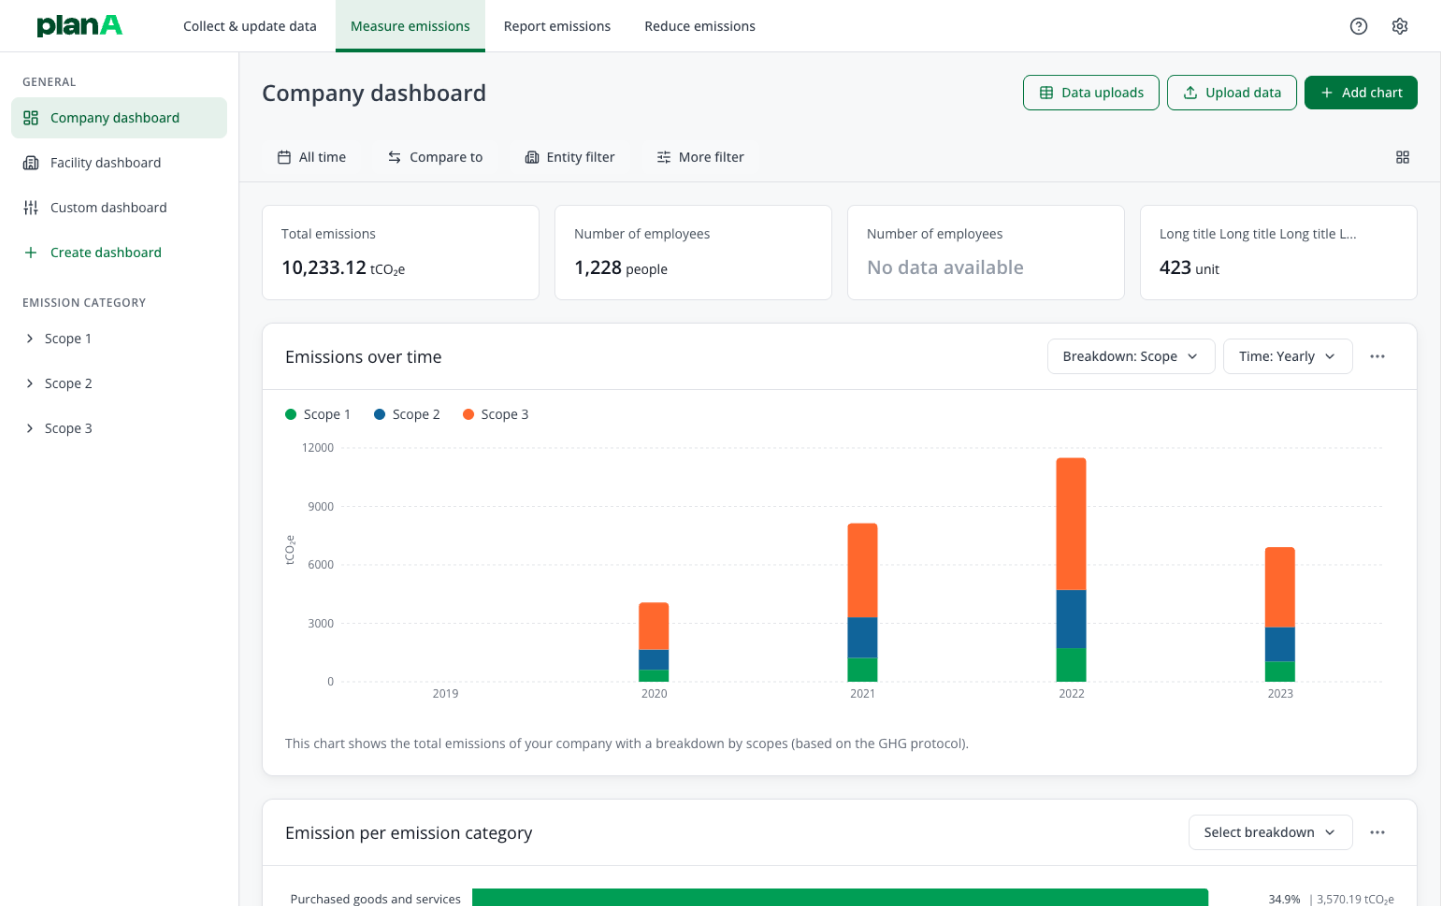
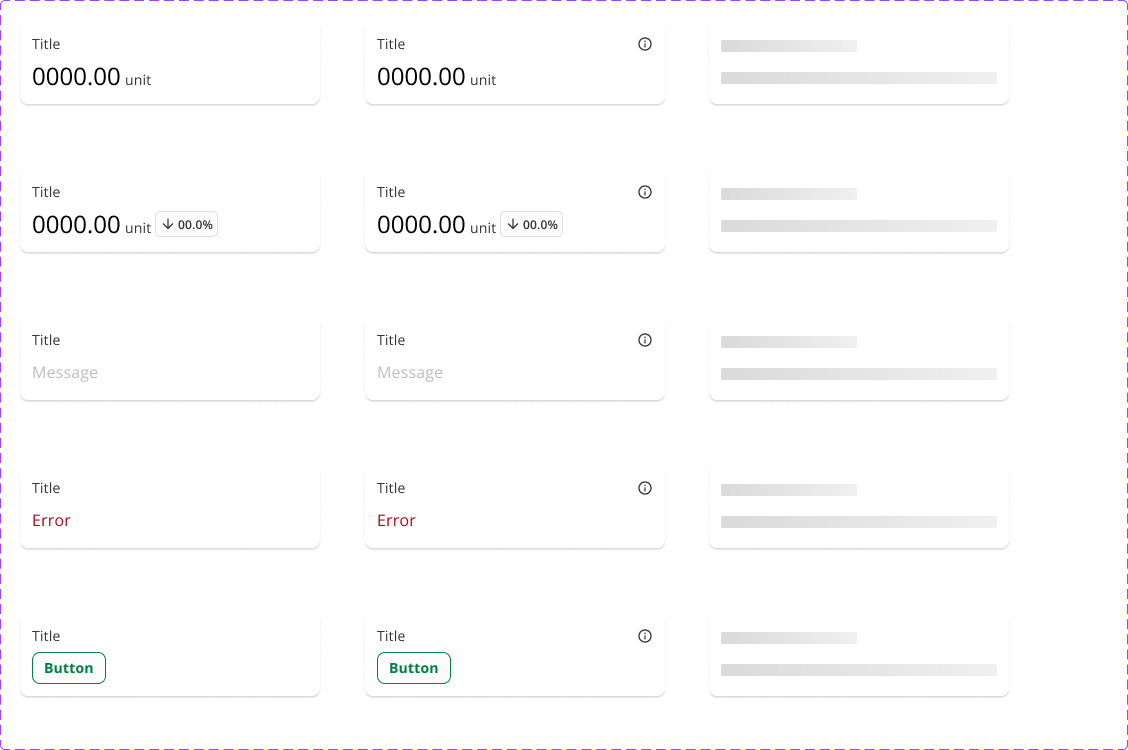
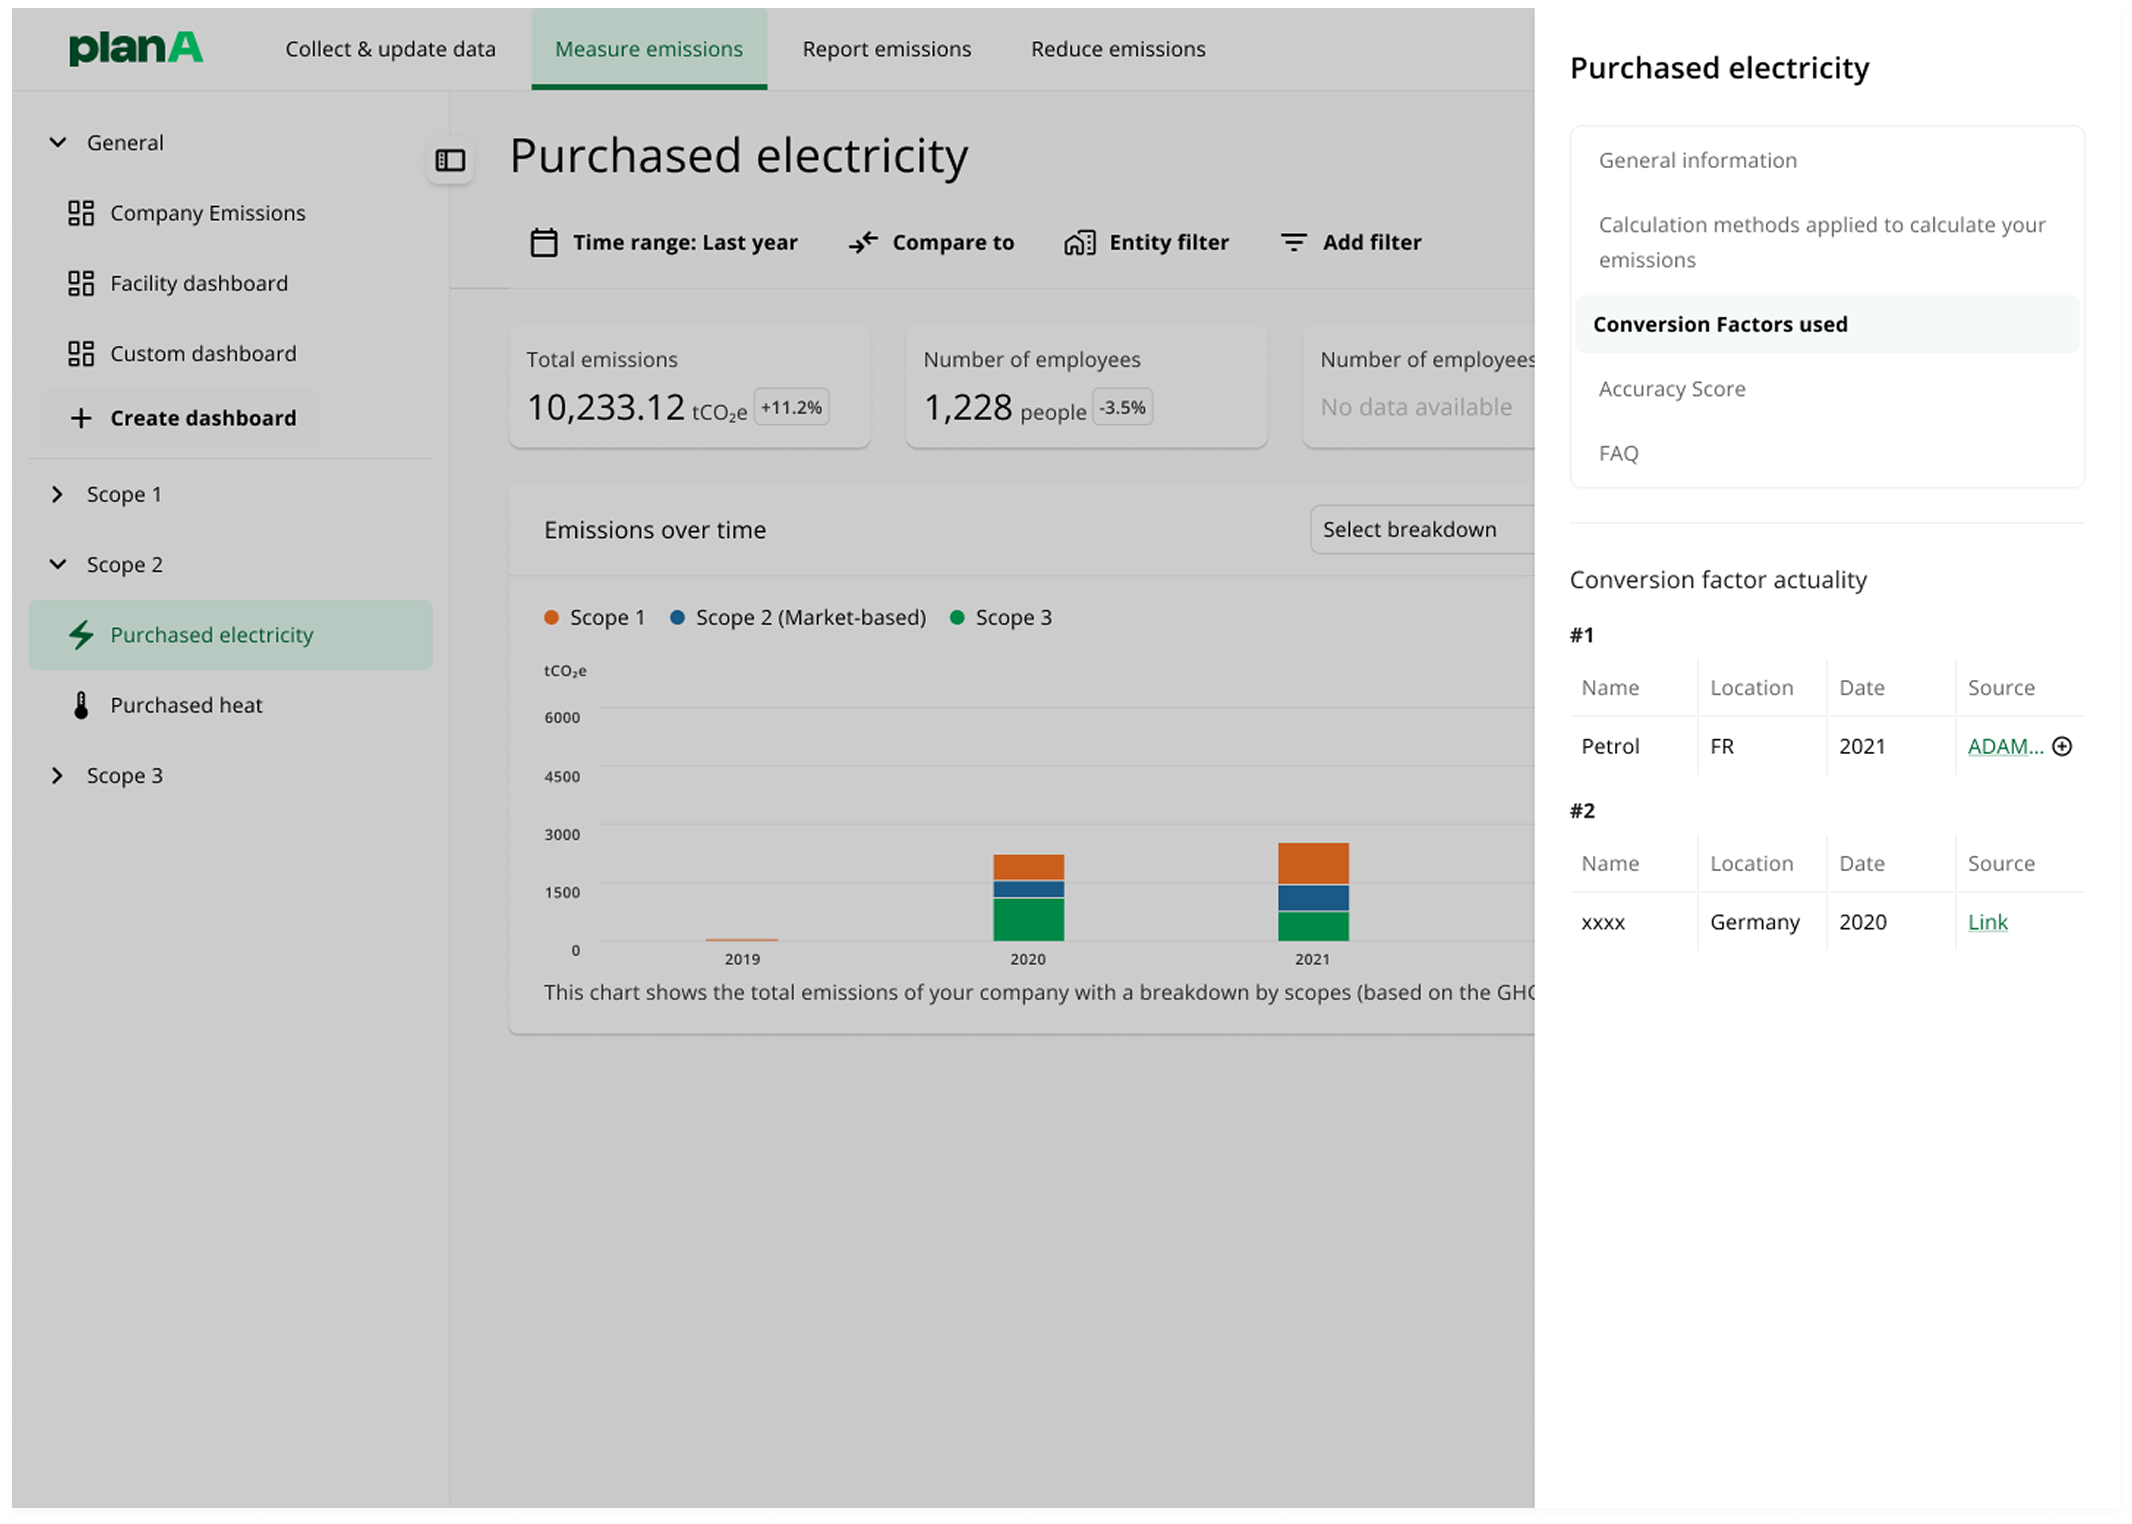
As the designer owning analytics and reporting, I drove the end-to-end revamp of the dashboard and reporting experience—from information architecture through the visual language users rely on to explore emissions data on their own. Alongside that work, I partnered with other design fellows to evolve the design system, so charting, states, and patterns stayed consistent as the product scaled.
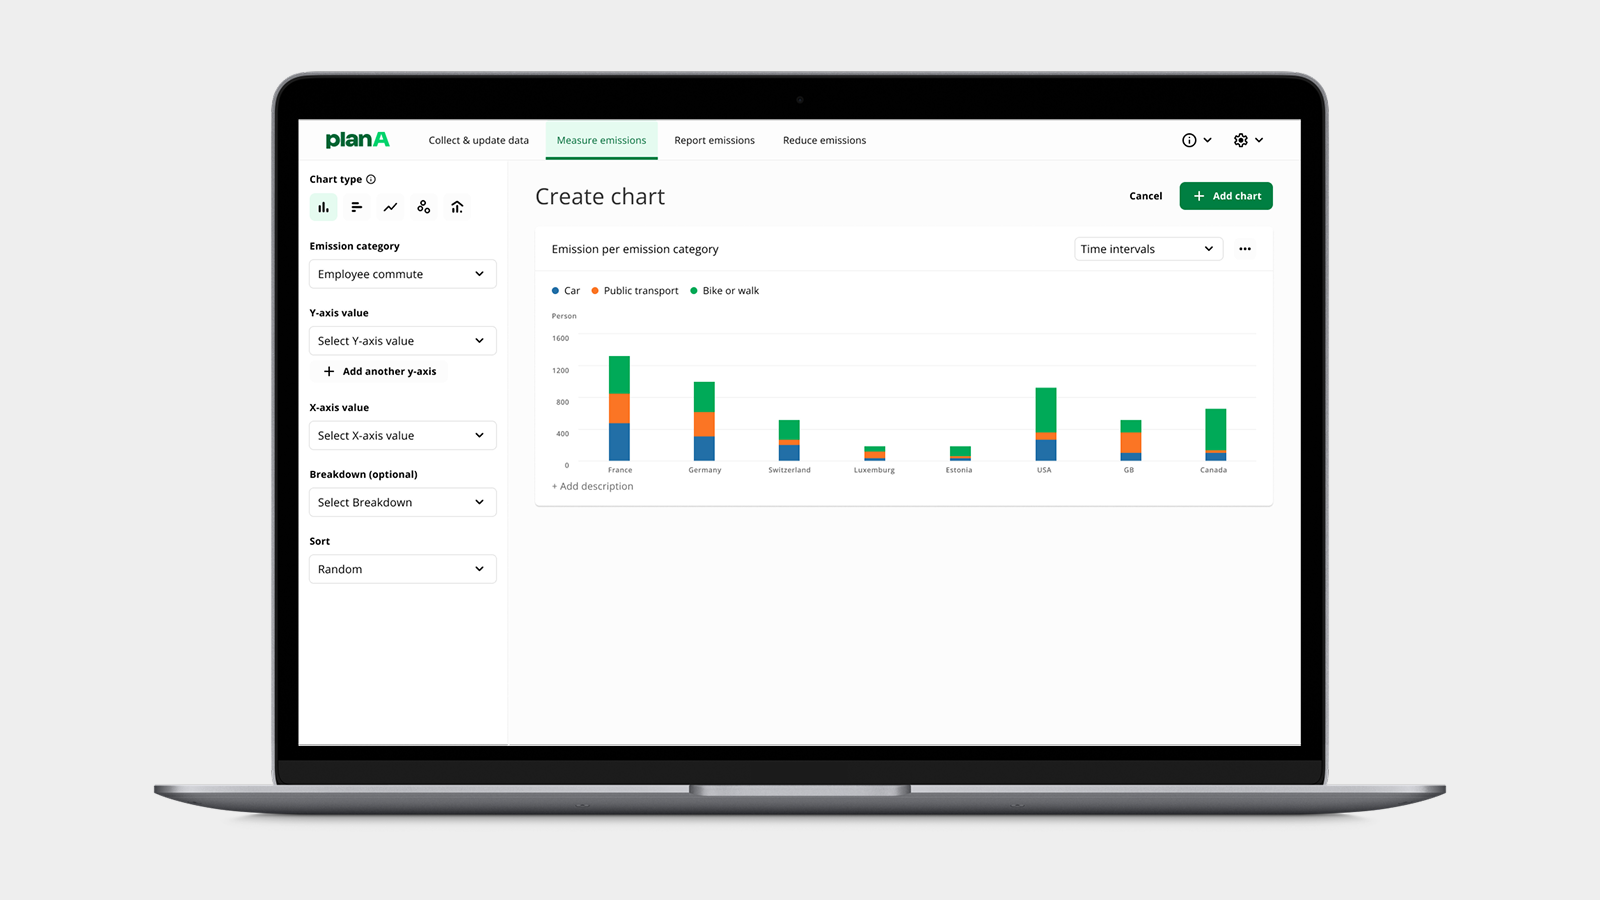
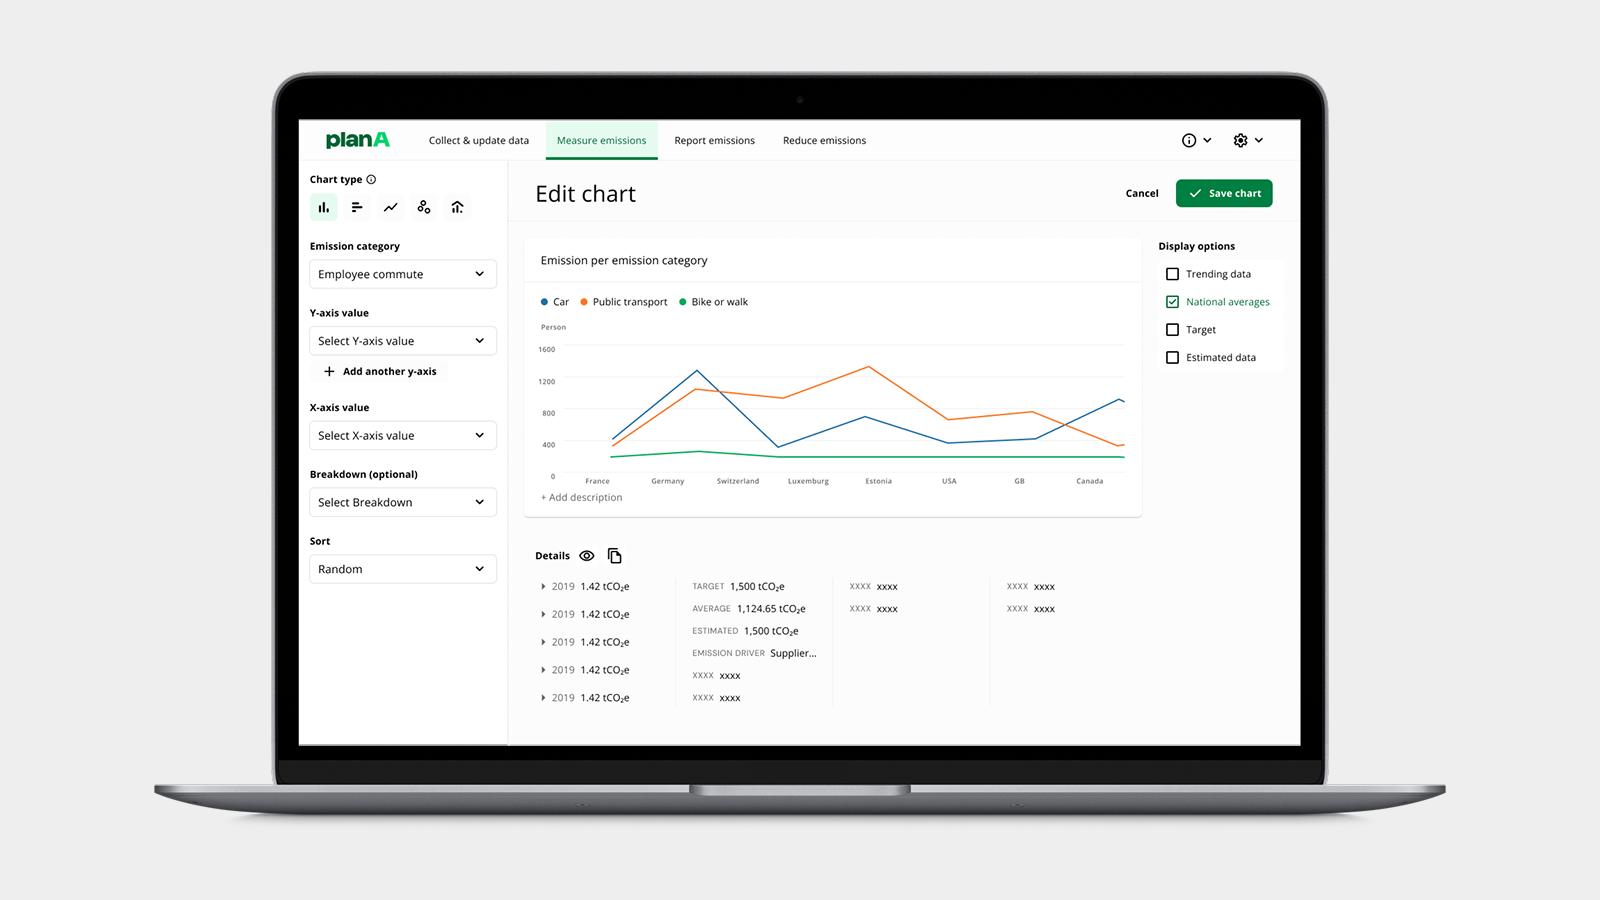
Customisation Engine: Built a modular system allowing users to build and refine custom charts by choosing specific emission categories, axes, and legends.
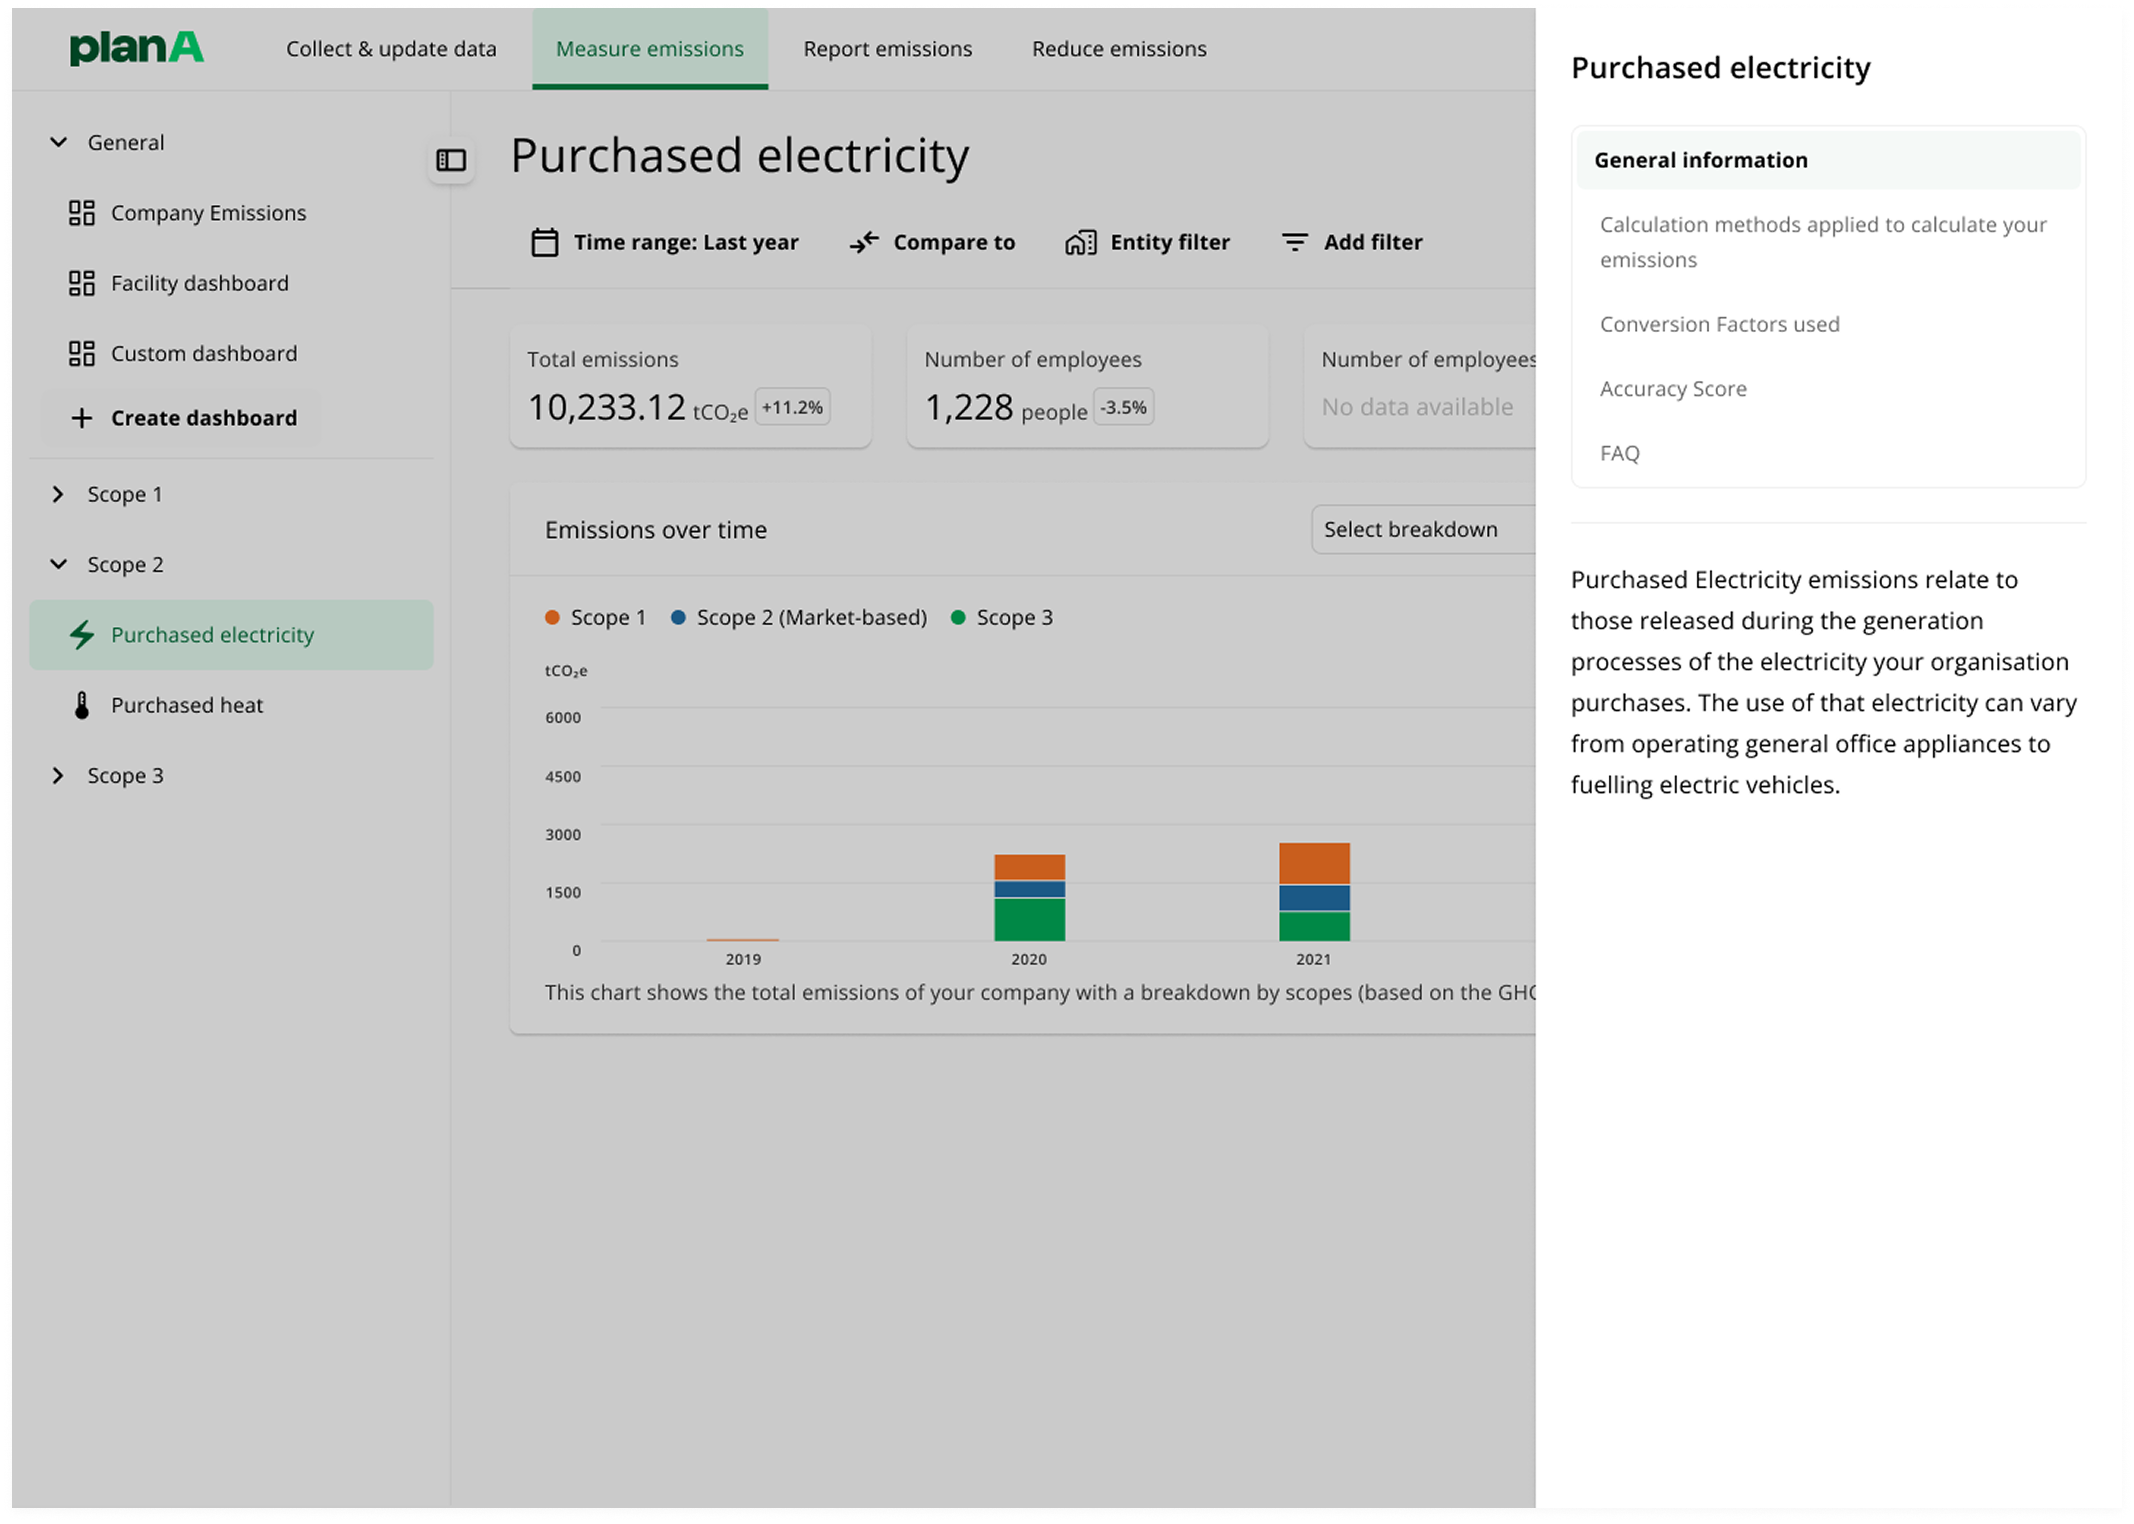
Methodological Trust: Strengthened trust in the underlying data by visually bridging the gap between high-level numbers and the complex methodology behind them.
Performance Engineering: Designed purposeful motion—including skeleton states and deliberate transitions—to reduce perceived wait times and turn moments of friction into a smoother experience.
A Strategic Shift to Self-Serve
The 2023 launch delivered measurable impact across the business and user experience.
- Business Impact: Reduced churn, and customer success reported fewer repeat escalations on exports and ad-hoc reporting after launch.
- Product Impact: Successfully enabled a strategic company-wide shift towards self-serve analytics, reducing the internal operational load.
- User Impact: Improved overall CSAT and drove a measurable increase in NPS scores through enhanced data visualisation and customisation.